

GameAnalytics share 5 key findings from their latest industry analysis, with data from more than 60K mobile games and 3 billion players around the world.
Editors note: this post was originally published by Ana Laura Serra, Head of Data Science at GameAnalytics. With extensive experience in applying mathematical models to real phenomena, she’s an expert at finding key insights from large amounts of data.
Understanding the world of mobile gaming can be a formidable and ever-changing task. To help give you some more insight into the industry, GameAnalytics produced a comprehensive report that captures where mobile gaming is now as a sector. If you want to read the full report, download yourself a copy here.
To give you an idea of the accuracy of our findings – GameAnalytics collected data from over 60K titles across more than 3 billion players. They’ve seen some interesting things happen over the past year that we’re excited to share with you. Whether you’re looking for future opportunities or comparing yourself against other titles in your genre, they’ve covered the major aspects of game performance in the gaming community to offer the market a reliable benchmark for 2017-2018.
How to read their graphs
We know you’re eager to dig into the data, but first we want to let you know how GameAnalytics put together their graphs and what their methodology is.
To avoid any bias from pre-launch titles skewing their analysis, GameAnalytics set a minimum threshold of 1,000 daily active users for each game. For titles that meet this minimum criteria, they’ve collected their findings and presented the data for each metric in two separate ways:
1. Overall Yearly View
- Aggregated genre data broken down into top, median and underperforming titles (green, yellow and red lines) to show industry trends over the last year.
2. Genre Specific Breakdown
- Data that looks specifically at how each genre is performing and highlights the top, median and underperforming KPIs (star, grey line and red arrow).
Now that you’re familiar with their graphs, let’s dig in…
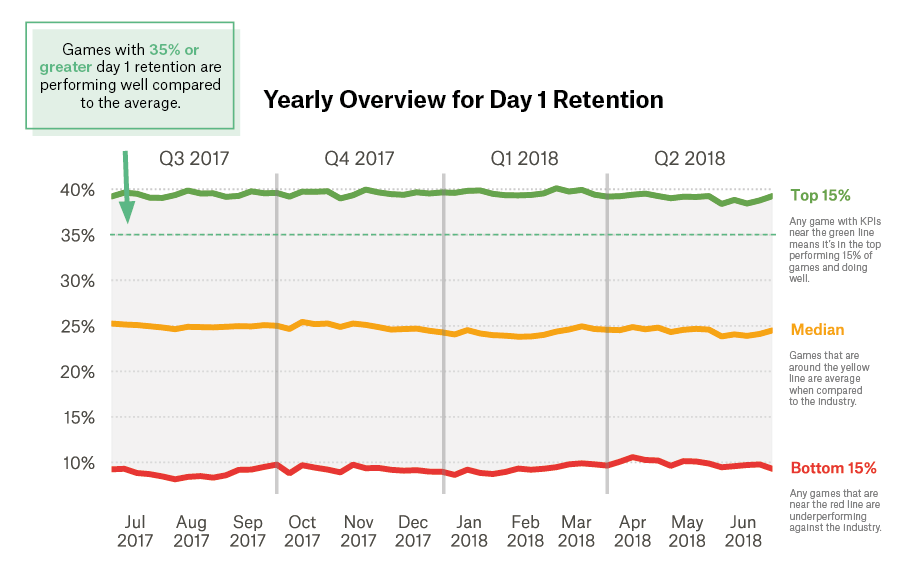
1. Games with 35% or greater day 1 retention are doing well
When we’re talking about game potential, retention remains one of the biggest measures. If your game has low day 1 retention (anything below 30%), the chances are it’s probably going to need a substantial rework.
It may seem like a rash decision, but dropping an underperforming title at this early stage could save your studio from unnecessary losses. Your fortune may well lie within your next project, so be cautious when investing in games that aren’t cut out for the big leagues.

Other D1 retention findings
- If a game has more than 40% day 1 retention, then it is doing really well.
- Kids games have extremely low retention – 15% is above average for this genre.
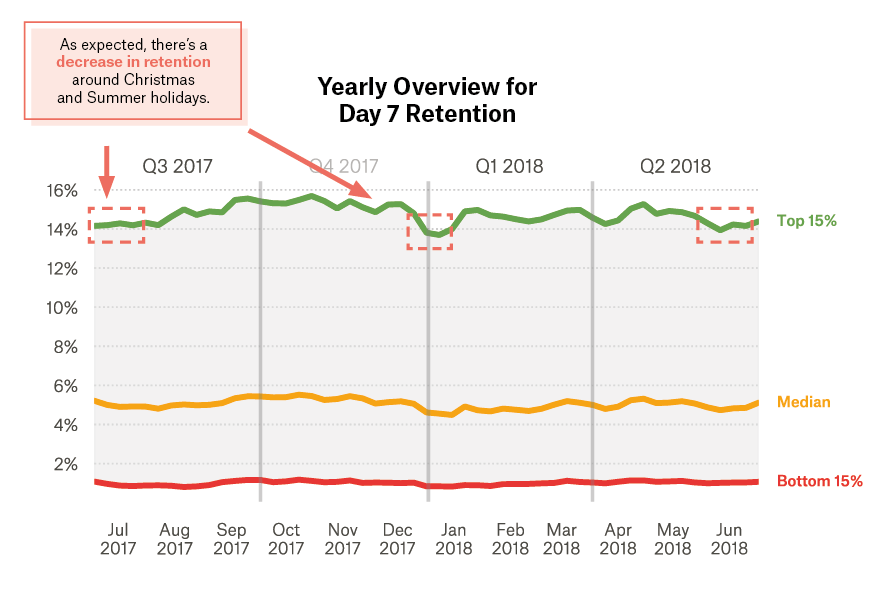
2. The best performing games have above 14% day 7 retention…
The first hurdle is simply reaching this stage with your platform. But if you manage to cross the threshold into day 7 with considerable retention rates, this is a very good sign.
Players can quite naturally lose interest after a week. If you want to keep your players loyal, it’s important that you do everything in your power to keep them entertained – be that with new items, skins, levels or upgrades.

Other D7 retention findings
- Retention to day 7 shows seasonality for the top 15% games.
- A typical Word game has 16% day 7 retention, compared to just 1% for Kids games.
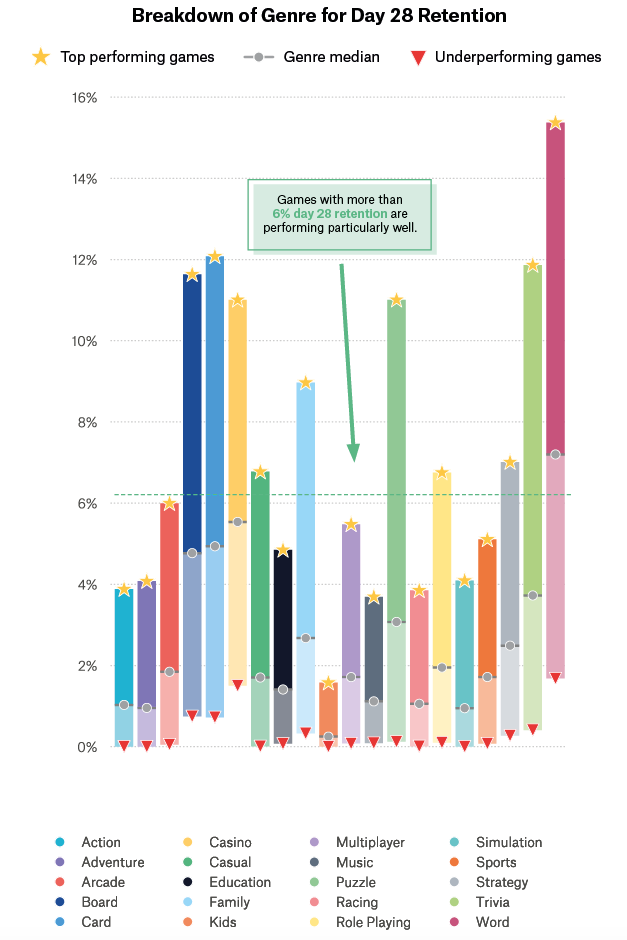
3. …but show only 6% day 28 retention
It’s incredibly impressive if more than 6% of your players are engaged with your game after a month. There is an unsurprising drop-off in terms of retention when we reach this stage of a game’s journey, with the best performing titles only showing 4-6%.
Endgame content is crucial here to keep your players engaged. If your game’s retention is struggling at this stage, consider PVP modes, leaderboards or daily challenges to encourage more competitive interaction.

Other D28 retention findings
-
- The bottom 15% have a D28 retention of 0%, showing how difficult it is to retain players for a full month.
- The highest retention is in the cold and boring quarter, just before Christmas.
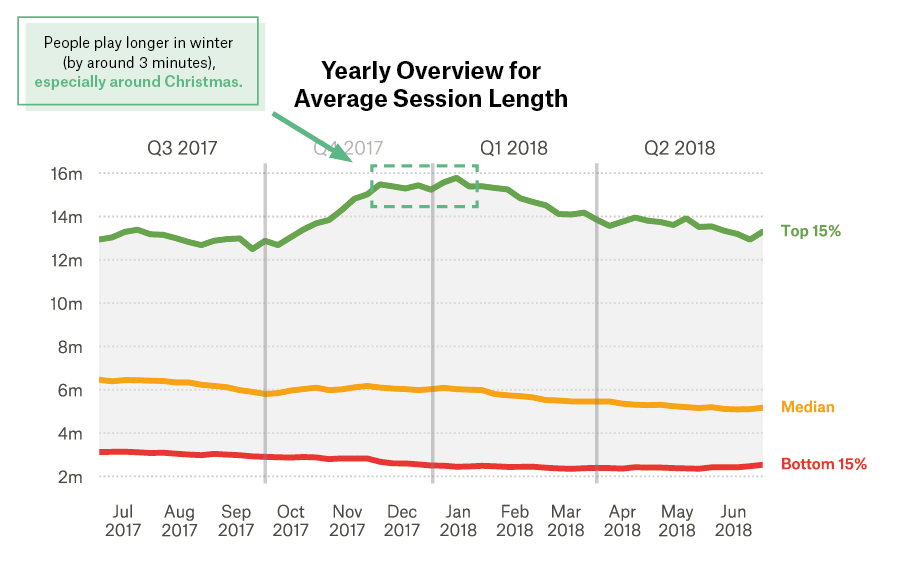
4. People play longer in the Winter months (by 3 minutes)
Certain games have mastered the art of increasing Average Session lengths (ASL). Other titles struggle to keep users active for more than three minutes.
GameAnalytics’ data shows that the top performing games have average session lengths of around 5-6 minutes, double that of the average.

Other session length findings
- ASL is slightly decreasing for underperforming titles, indicating that the top 15% actively engage players with marketing campaigns.
- Casino and Card are the genres with longest ASL (these genres have a great deal of overlap).
5. There’s a 8-10x gap between the top performing titles and all other games
The industry for Average Revenue Per Paying User (ARPPU) varies a lot, but interestingly it only does so for the upper 15% games. This indicates that only the best studios are monetizing effectively with marketing campaigns and promotions, and therefore receive the lion’s share of the industry revenue.
There are many ways to encourage players to spend money. Analysing how successful titles have used basic strategies, like push notifications or timely promotions, may offer you some valuable insight into how to do the same.

Other revenue findings
- Spending habits are erratic in top performing titles, indicating that they’re running more successful marketing campaigns throughout the year.
- For top performing games, Racing, Action and Arcade stand out as the highest performers – with $1.6 ARPPU.
Download the full report!
If you’re looking for loads more insights from GameAnalytics, go ahead and download the full report here: Mobile Industry Benchmarks Report (2018 Edition)